

How to generate charts in Smallppt presentations?
Updated over 2 months ago
How to generate a chart?
Method 1: Automatically create charts via AI
- When you use Smallppt to generate a presentation, AI will automatically recognize the information structure based on your content and generate charts when needed.
- These charts will:
- • Automatically match the visual style of the current template
- • Automatically adapts to the layout and content arrangement, generally requiring no additional adjustment of position or size after generation.
Method 2: Manually insert a chart
Step 1: Open the Insert Chart panel
Open the presentation editing page and find the Insert panel on the right.
Step 2: Select a Preset Chart
Click on the chart and select one from 8 basic chart types (such as bar chart, line chart, pie chart, etc.).
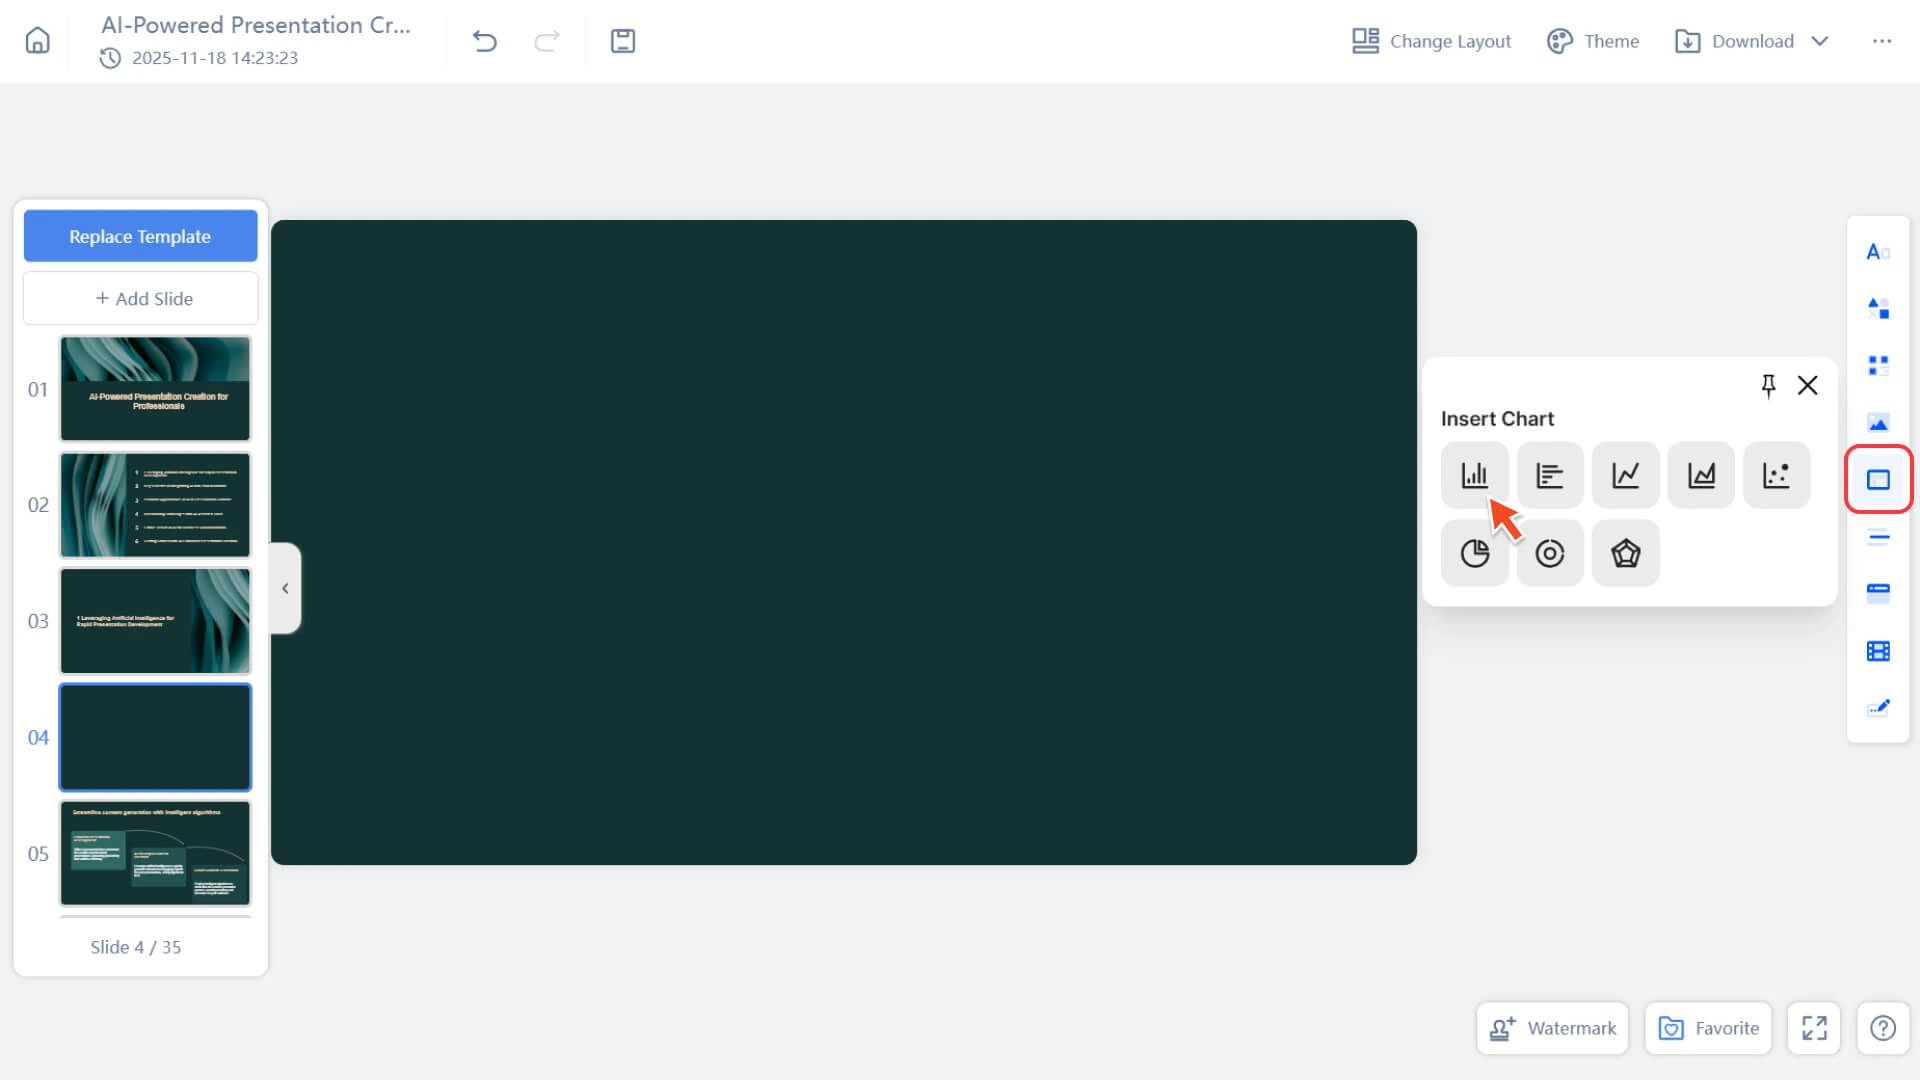
Step 3: Insert Chart
Click Insert, and the chart will appear on the current slide.
Note: Manually inserted charts will not automatically follow the theme color. They will use the default color scheme, so you may need to:
• Modify Chart Color
• Adjust Background
• Set font style
• Manually match the theme style
How to edit a chart?
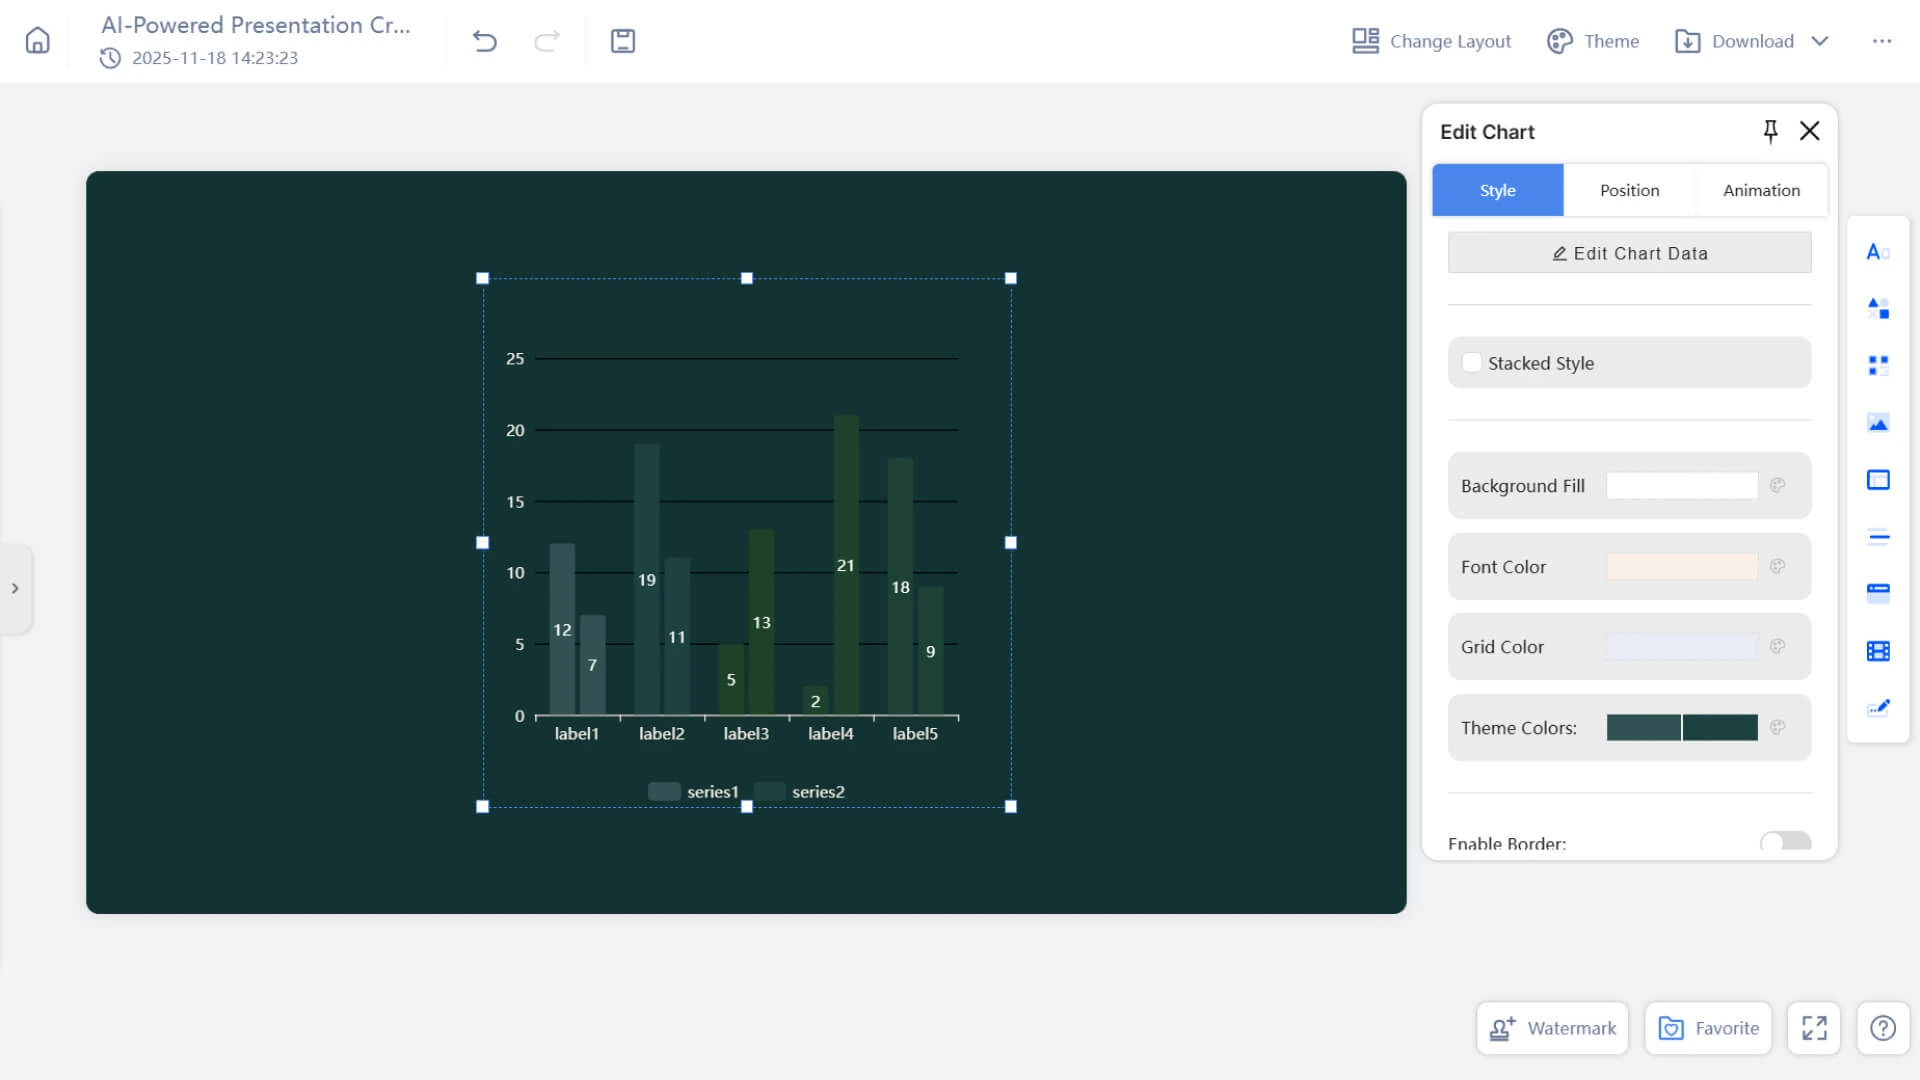
Whether the chart is automatically generated or manually inserted, you can further edit it:
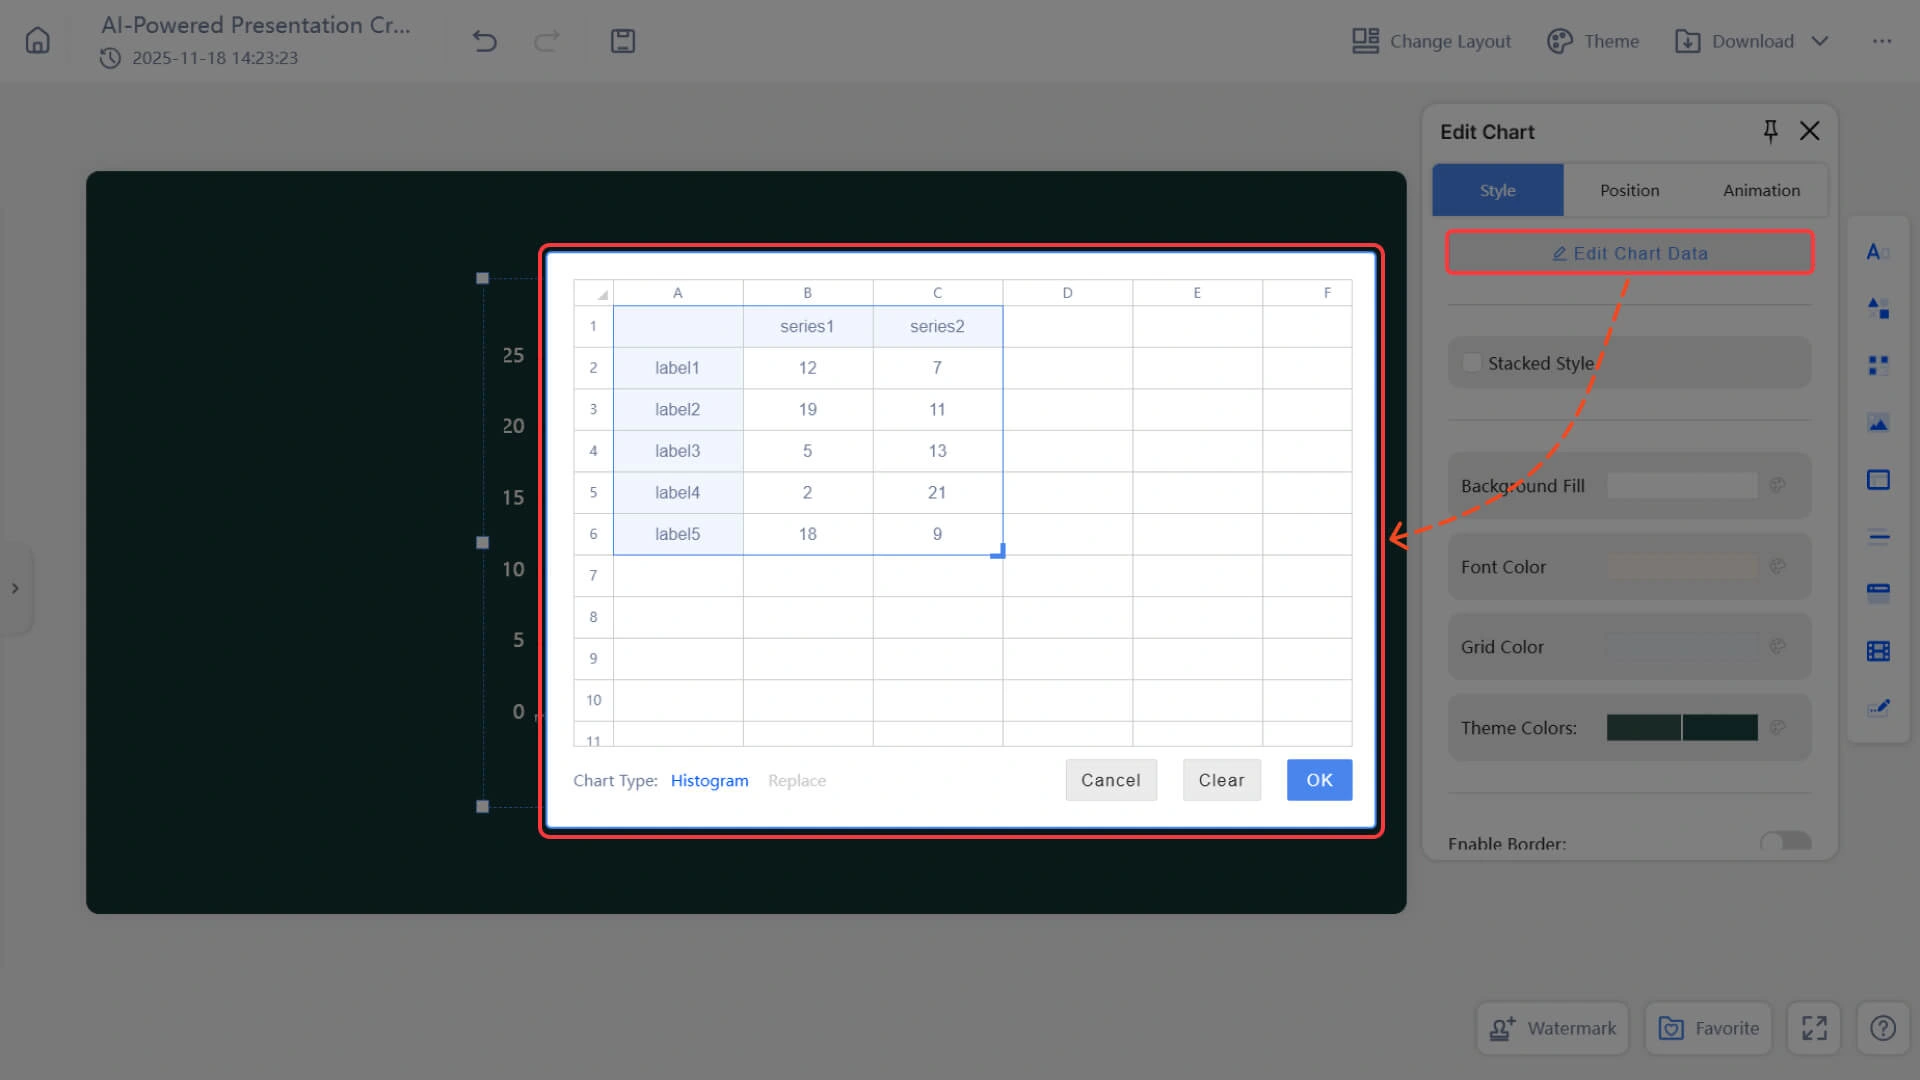
• Edit Chart Data
◦ After clicking on the chart, the "Edit Chart Data" panel will appear
◦ You can directly enter or modify data in the table
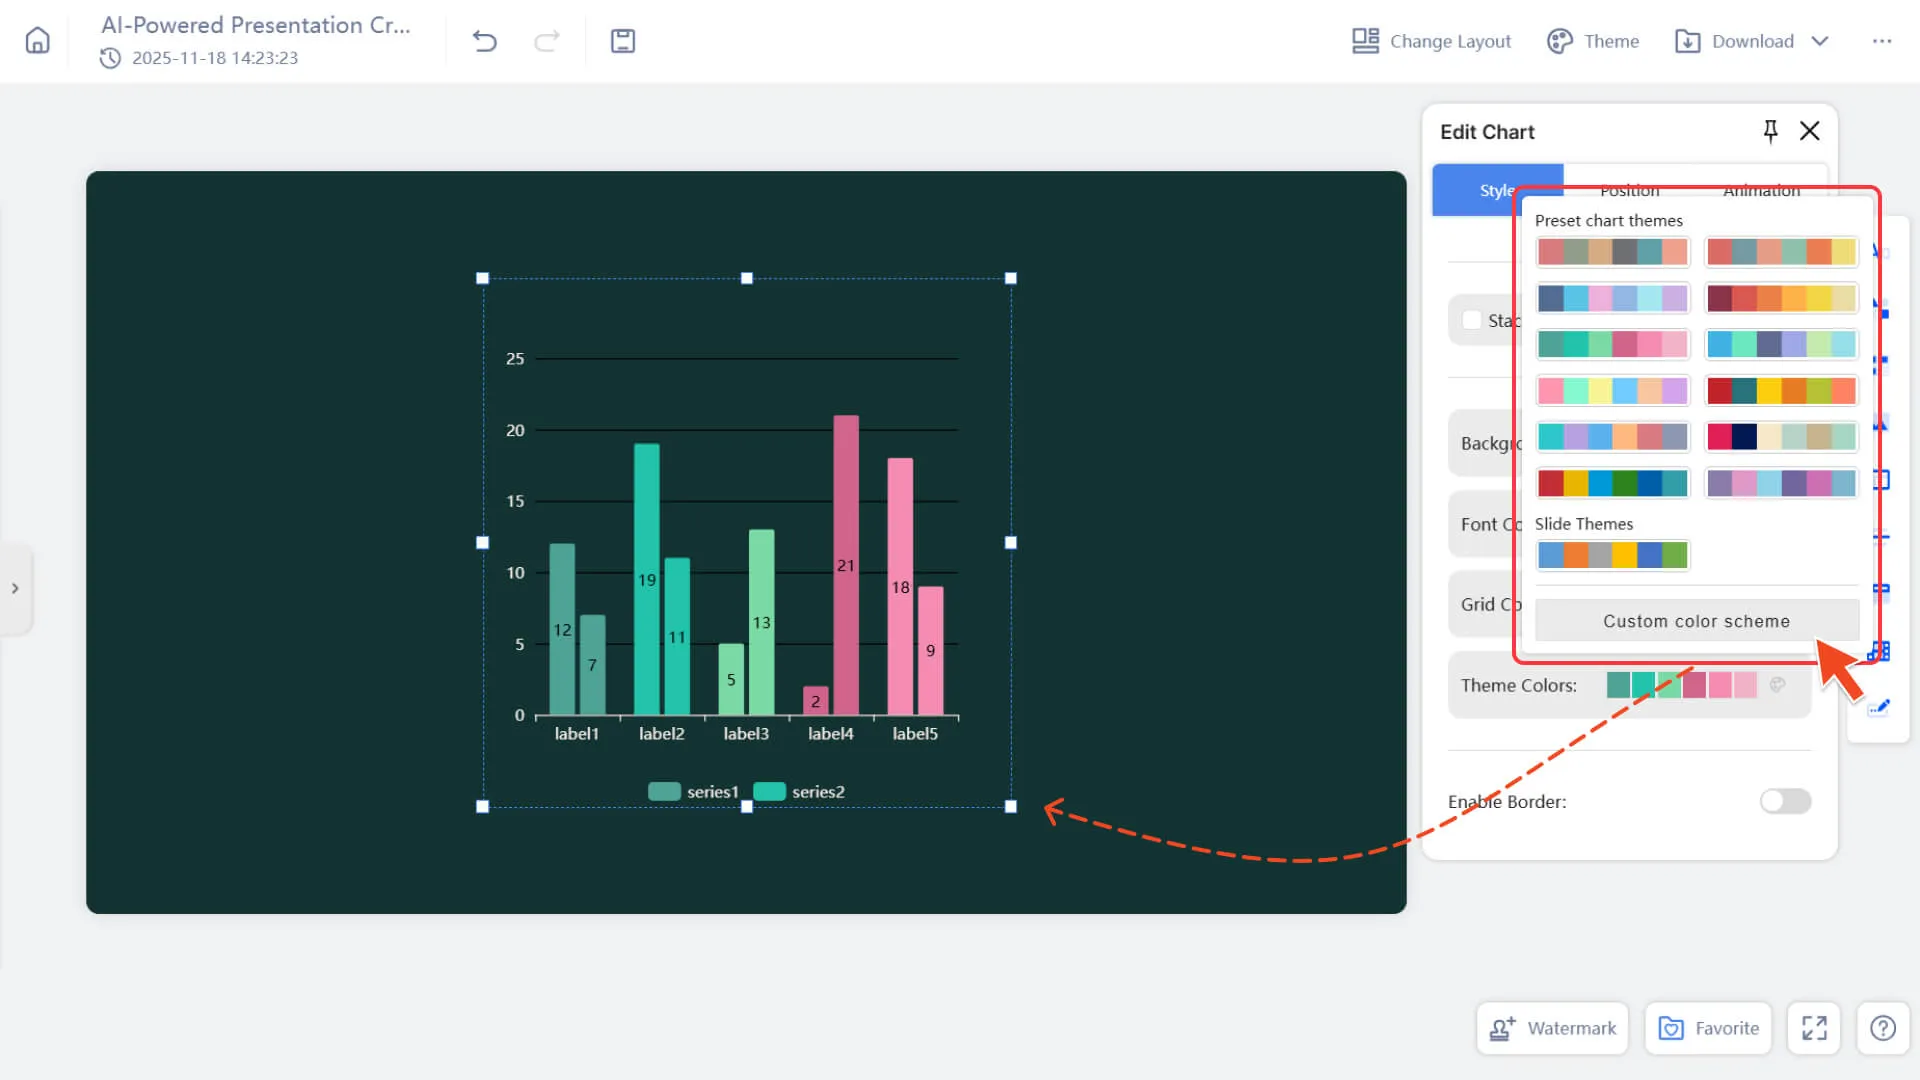
• Adjust Chart Style
◦ Background Fill Color
◦ Font Color
◦ Gridline Color
◦ Chart Theme Color
◦ Border
• Adjust Chart Layout
◦ Drag the chart to change its position
◦ Resize by stretching the border
◦ Coordinate with the layout for better typesetting
• Add animation effects
◦ Enter the animation panel after selecting the chart
◦ Add animations such as entrance and emphasis to the chart
◦ To learn more, please visit:
Frequently Asked Questions
Why does the color of the inserted chart not match the template theme?
- • Currently, manually inserted charts will use the default color scheme and will not automatically adapt to the theme color of the current template for the time being.
Can the charts in the generated AI slides be re-edited?
- • Yes. The charts automatically generated by AI also support data modification, style adjustment, and reformatting after being clicked.